
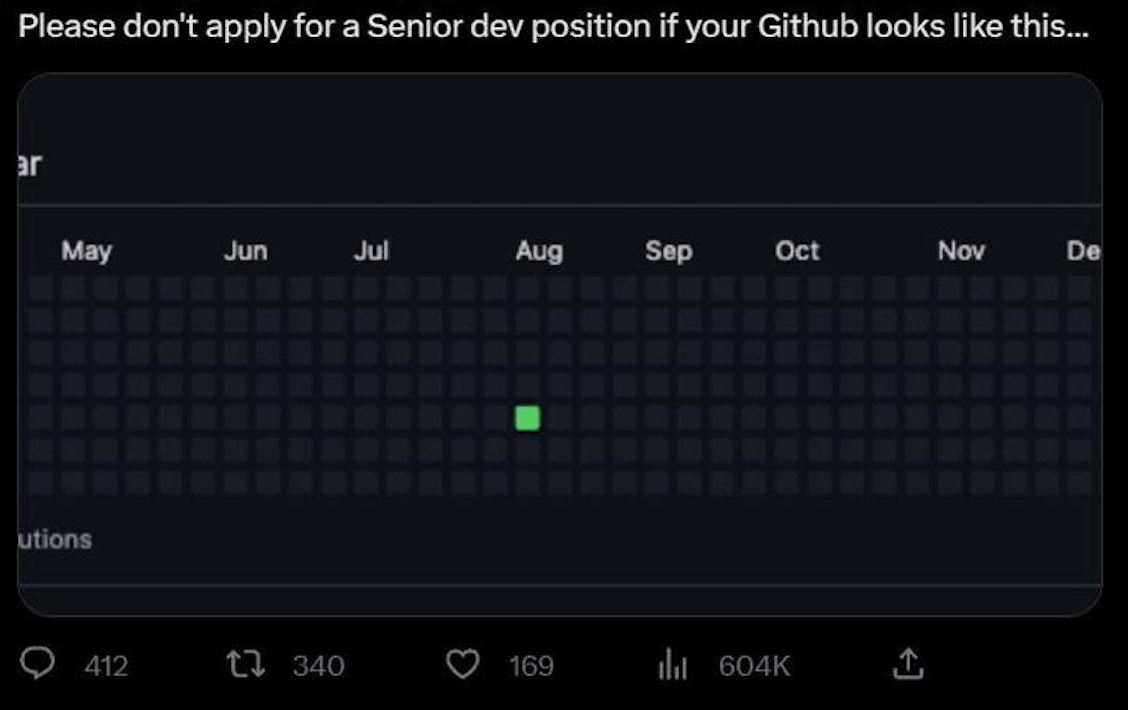
Recently, got viral on Twitter, a tweet from someone saying that if your GitHub profile looks gray (we have a contributions graph on GitHub, if you have contributions in a specific time you will get a green square, otherwise you will have a gray square that indicates inactivity), you shouldn’t apply for senior positions.
 |
|---|
| The Original Polemical Tweet |
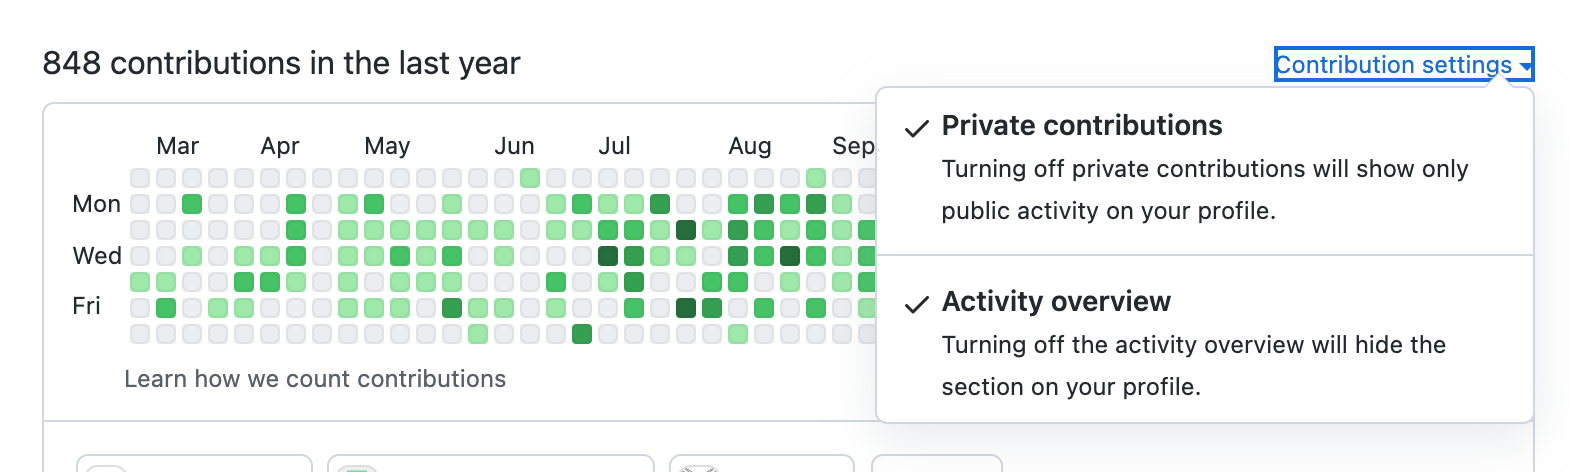
First, we need to understand how this contribution graph works. Certain actions count as contributions, like committing to a repository, opening an issue, opening a Pull Request, submitting a review, etc. Contributions in private repositories count too since you enable it.
 |
|---|
| How to enable GitHub to show private contributions stats in the contributions graph |
I used the situation to share a tip about git on my Twitter, which surprises me due to a lot of people that use git every day don’t know about it. You can see the Tweet here (in Portuguese). So, I thought it will be a good idea to write it here.
Git provides us an argument that you can change the commit date. This is very useful when you are participating in events like #100DaysOfCode, or related events. You can use this argument too when you forgot to commit the changes and want to keep a chronological history.
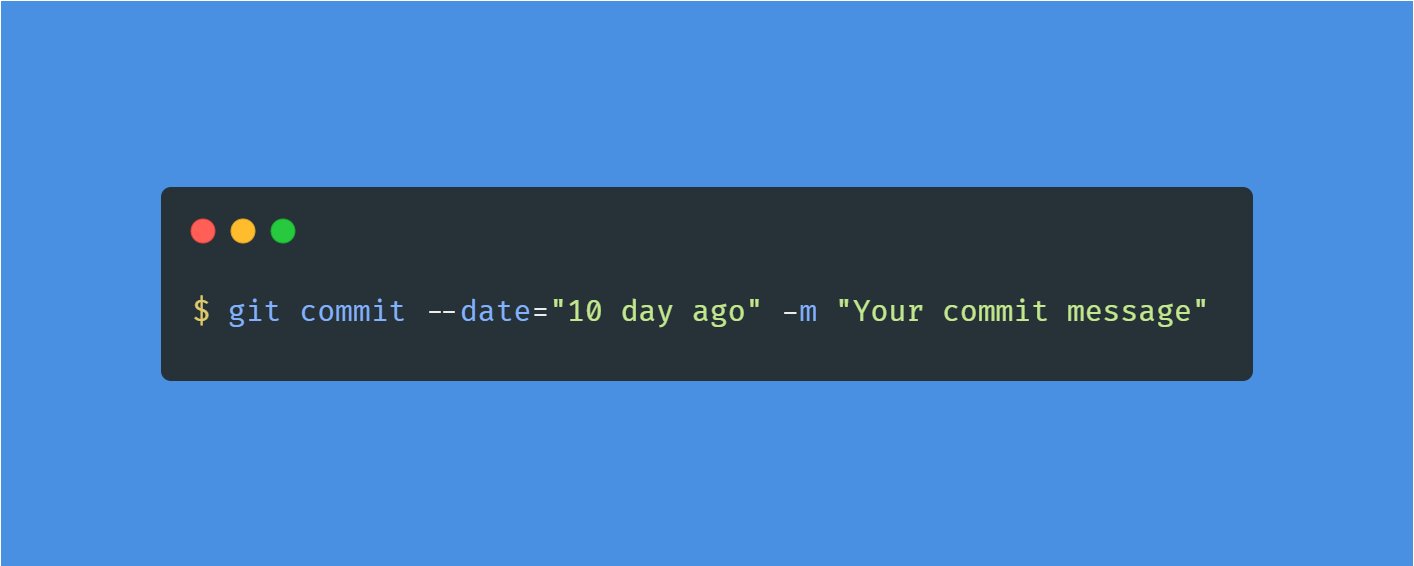
Yes! You can use the --date="" argument to specify the date, creating commits in the past. You can provide a lot of date formats, including human-readable ones.
Just for clarification, it will override the GIT_AUTHOR_DATE data of the commit, which means when someone first created the commit with git commit. In another hand, we have the GIT_COMMITTER_DATE, which means the last “modification” of the commit. This is the information that you see when you open the history of a branch in GitHub. The commit date is identical to the author date unless someone changes the commit date by using git commit --amend, a force push, a rebase, or other Git commands.
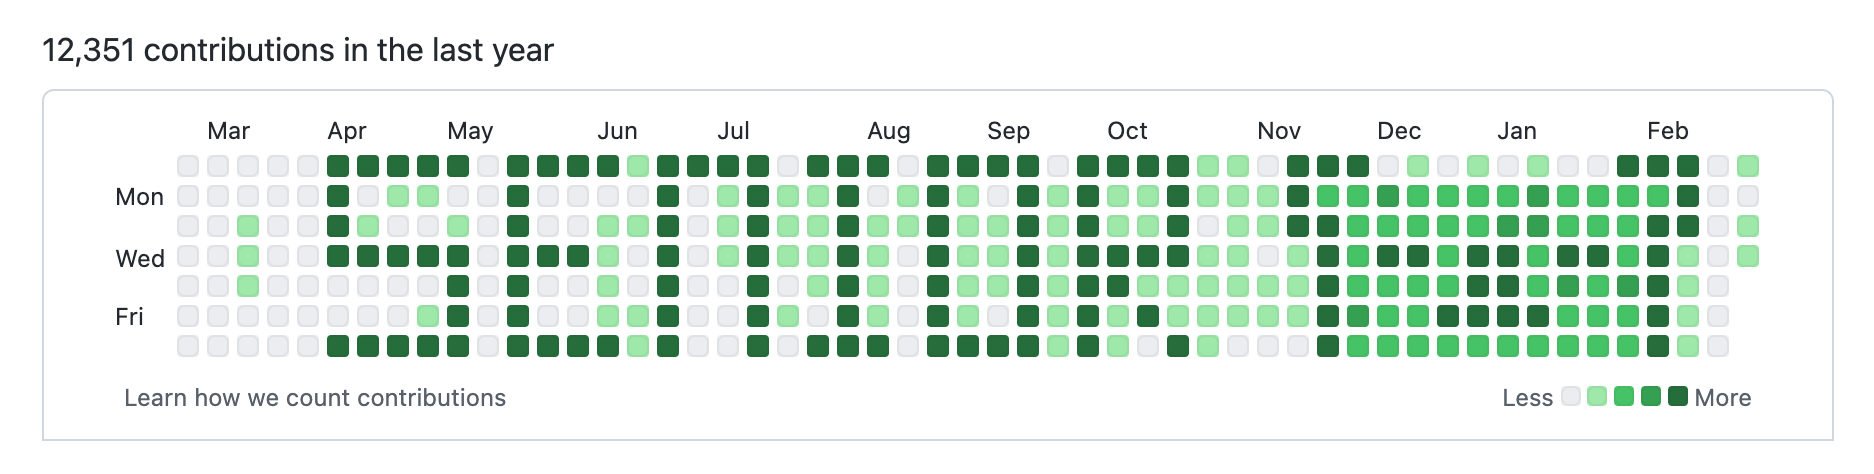
With that, you can hack your contributions graph on GitHub, and display whatever you want using pixel art. Some tools like GitHub Art can help you to draw anything. See the example below.
 |
|---|
| jh3y profile |
But, this isn’t the point. I don’t want to teach you how to make your GitHub profile green. This is just a useless Vanity Metric. This blog post’s purpose is just to share knowledge about git and prove that the GitHub Contributions Graph doesn’t mean noting. Especially for Senior Engineers who, in most cases, use their time to teach and help others, or help in architecture decisions. Work isn’t just git commits.
Another point is that you can add someone as a co-author, and draw in other profiles. A possible solution for this problem could be only counting signed commits as contributions to show in this graph.
References
That’s it! Thanks for reading.